Market Data Bank
A LOSING QUARTER FOR STOCKS
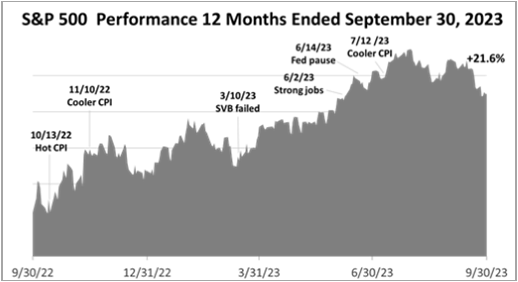
The Standard & Poor's 500 stock index lost –3.3% in Q3 2023, following strong gains in the three previous quarters of +8.7% in Q2 '23, +7% in Q1 '23 and +7.6% in 4Q '22. Stock prices were hurt in the third quarter by the rise in interest rates, which made bonds more valuable relative to stocks.
INFLATION DOMINATES STOCK MARKET
In the 12 months ended Sept. 30, 2023, the main factor moving stock prices was inflation. The Fed's tight monetary policy drove lending rates to a 22-year high, casting doubt on whether a "soft landing" was possible and raising the likelihood of a recession. An unusually strong labor market bolstered bulls.
12-MONTH INDUSTRY SECTORS
Low interest helped propel tech stocks to the top of the 10 industry sectors in the S&P 500 stock index in the 12 months shown by giving them access to cheap capital to hire, acquire, and re-tool. Low rates, at the same time, made utilities the worst performer because it made their dividend yields less attractive.
FIVE-YEAR ASSET PERFORMANCE
Of the diverse group of 13 assets represented by indexes, U.S. stocks were No. 1 in the five years through Q3 '23. Agriculture outperformed, as world population continued to grow and climate change made this commodity more expensive. Crude oil, a volatile asset, was a losing investment, as the pandemic crushed demand.
U.S. MANUFACTURING CONSTRUCTION
The U.S. stock market in the five turbulent years shown endured two bear markets, but provided nearly triple the return of European equites and nine times the return on Asian stocks. Chinese stocks, which dominate performance of emerging market stock indexes, lost -16.6% in the five-year period.
FED FUNDS RATE
Despite two bear markets, U.S. stock returns were No. 1 of among a broad array of 13 indexes in the five years ended March 31, 2023. While oil and energy outperformed in the last year, the index of crude oil investments lost -23.7% versus a 69.9.5% return on the S&P 500 index over five years.
Past performance is never a guarantee of your future results. Indices and ETFs representing asset classes are unmanaged and not recommendations. Foreign investing involves currency and political risk and political instability. Bonds offer a fixed rate of return while stocks fluctuate. Investing in emerging markets involves greater risk than more liquid markets with a longer history. Indices are unmanaged and not available for direct investment. Investments with higher return potential carry greater risk of loss. Sector performance data from Standard and Poor's.


